If you have never used Power BI or have never connected Power BI to Dynamics 365 Finance and Operations, it can be a bit tricky to get connected and start building reports. In this post I will take you through step by step how to connect Power BI to Dynamics 365 Finance and Operations, build your first report, and publish it to your Power BI workspace.
Download Power BI Desktop
The first thing we will need is the Power BI Desktop application. You can download this for free at the Microsoft App Store. Click your windows button and search for “Microsoft store”.
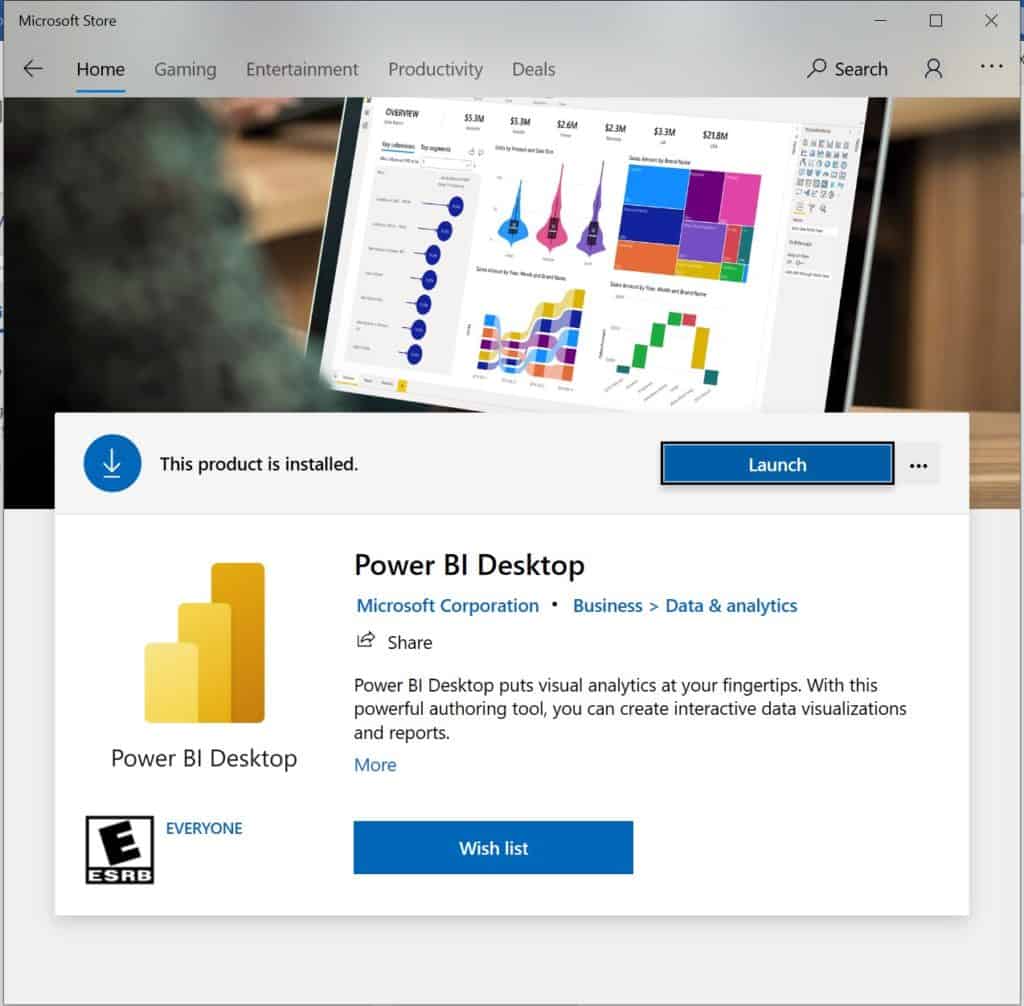
In the Microsoft store search for Power BI Desktop. Download the Power BI desktop by clicking the download button (mine says launch because I have already downloaded it). Note that if you want to share your Power BI report you will need a Power BI Pro license. You can sign up for a free trial at powerbi.com.
Connect Power BI to Dynamics 365 Finance and Operations
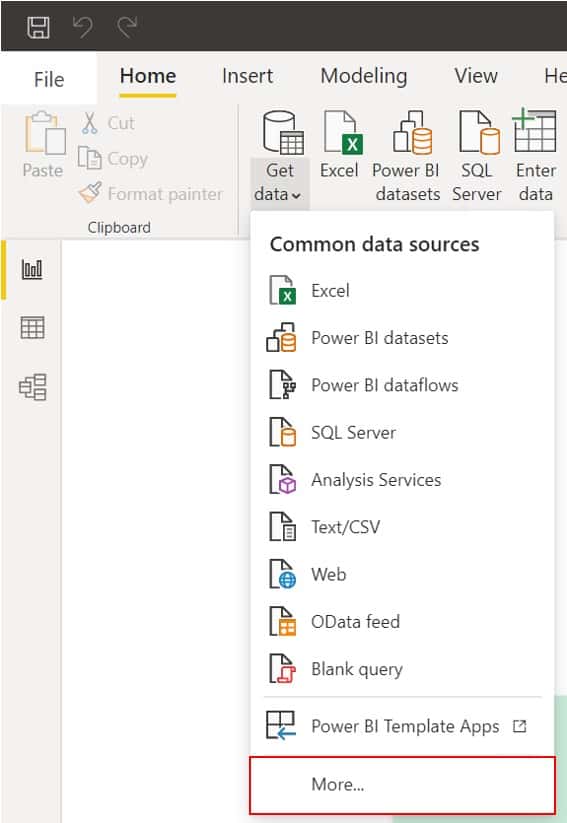
After you have downloaded the Power BI Desktop, launch the Power BI Desktop application. In the ribbon click the “Get data” button and click “More…”.
Click the “Online services” tab, click the “Dynamics 365 (online)” option and click “Connect”.
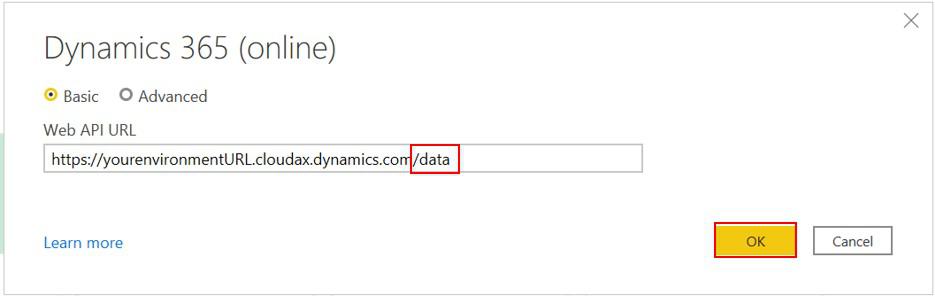
In the Web API URL paste in your Dynamics 365 Finance and Operations environment URL. Make sure that at the end of the URL you add “/data”. Then click “Ok”.
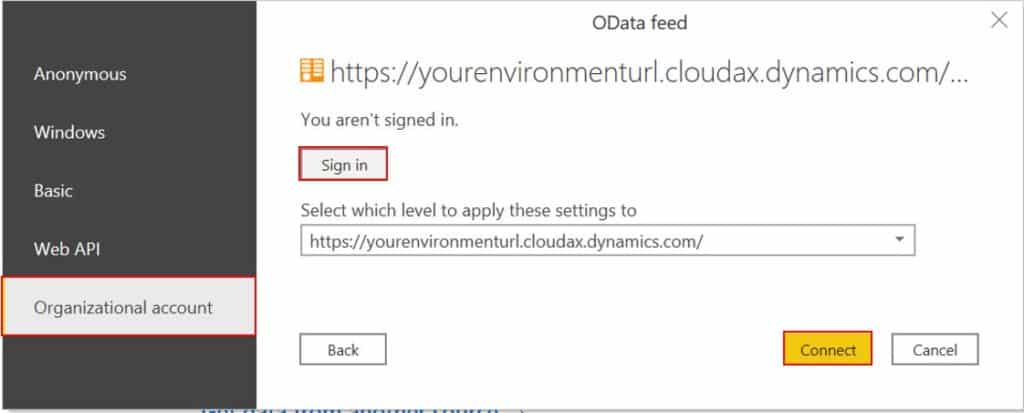
The next step is to authenticate. Click the “Organization account” tab and click the “Sign in” button. Sign in with the same username and password you use to sign into Dynamics 365 Finance and Operations. Then click the “Connect” button.
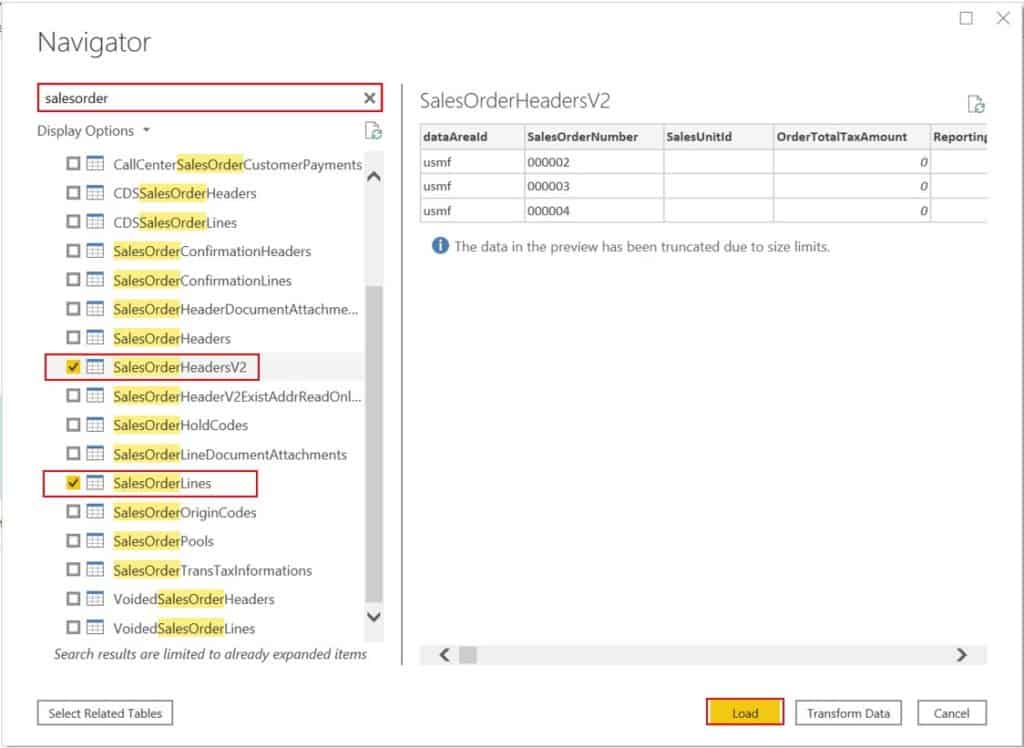
Once you have authenticated you will need to select the data entities you will need to build you Power BI reports. To do this you can search for the entities you need and select each one by clicking the checkbox. You can also preview the data in the pane to the right. Once you have selected all the data entities you need click the “Load” button. This will begin loading the data into Power BI.
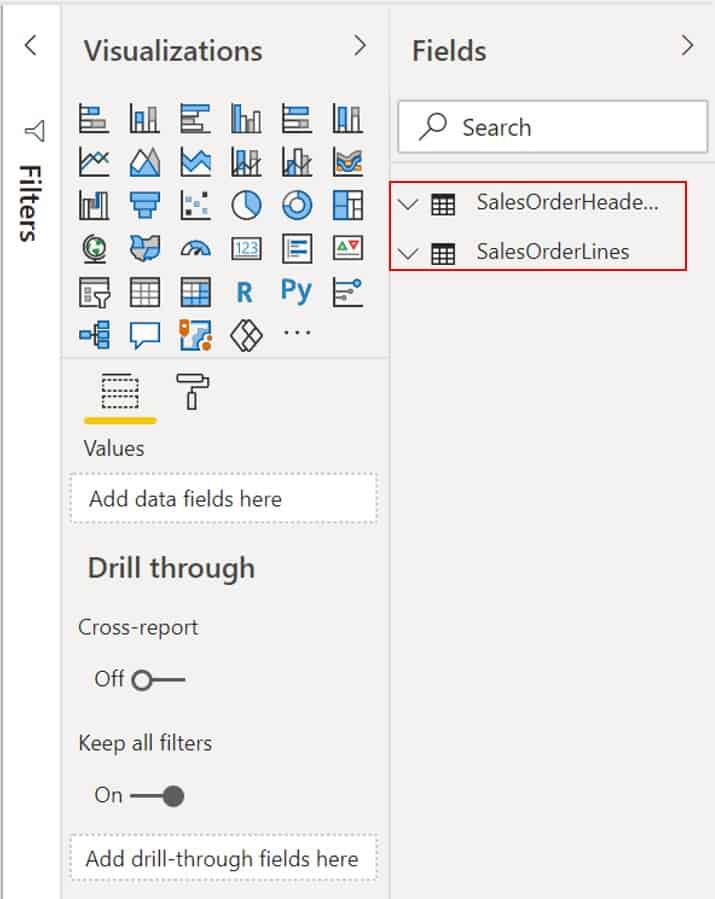
Once the data loads you will see the tables appear on the right hand side of the form.
Build Your Power BI Report
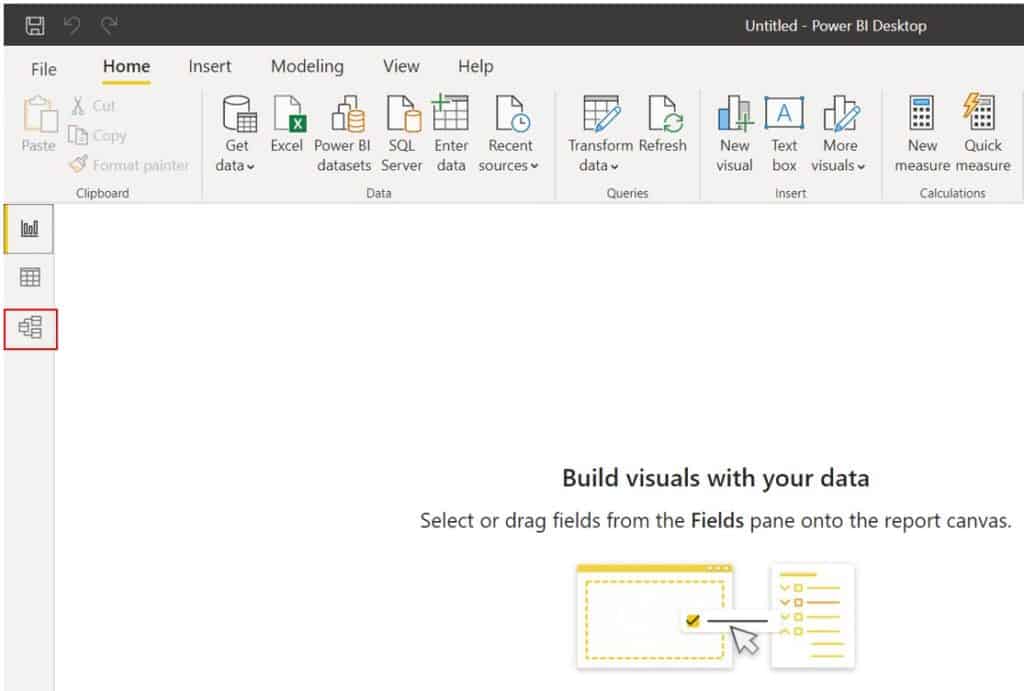
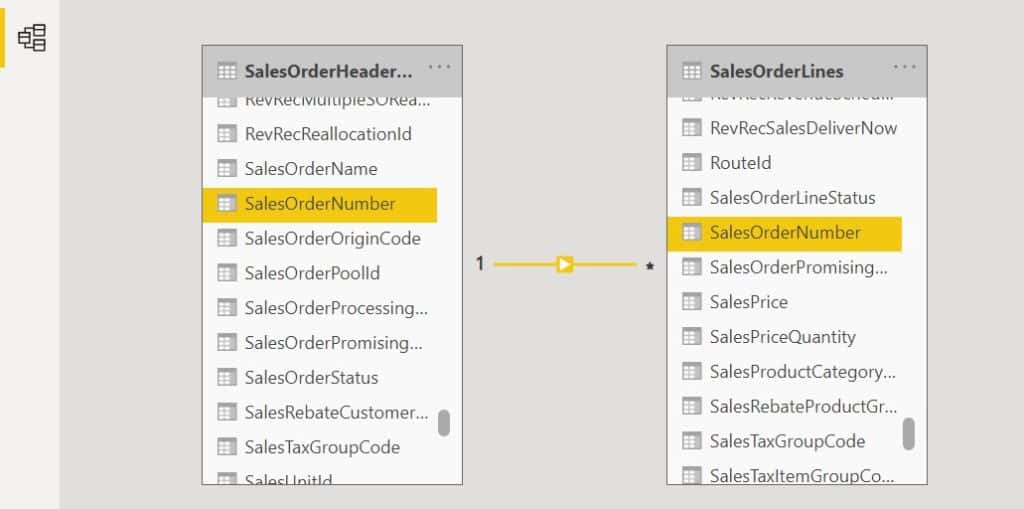
Next, we need to define the relationships between the data. Typically, a star schema is used with one fact table related to multiple dimension tables. In this case my fact table will be the sales lines and the dimensions I need will reside on the sales order header table. On the left side of the form click the “Model” button.
To create the relationship, you can drag the related field which is the primary key to the related field in the other table. In this case the key is the sales order number which links the sale order header records to the sales order lines records.
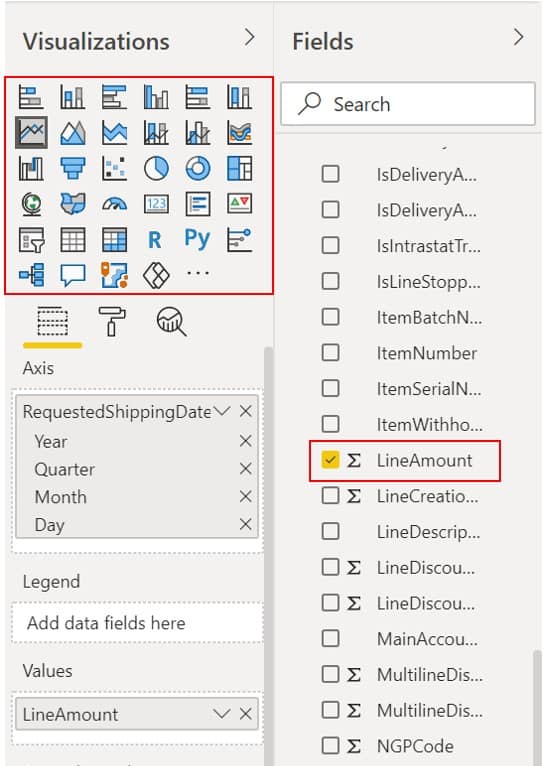
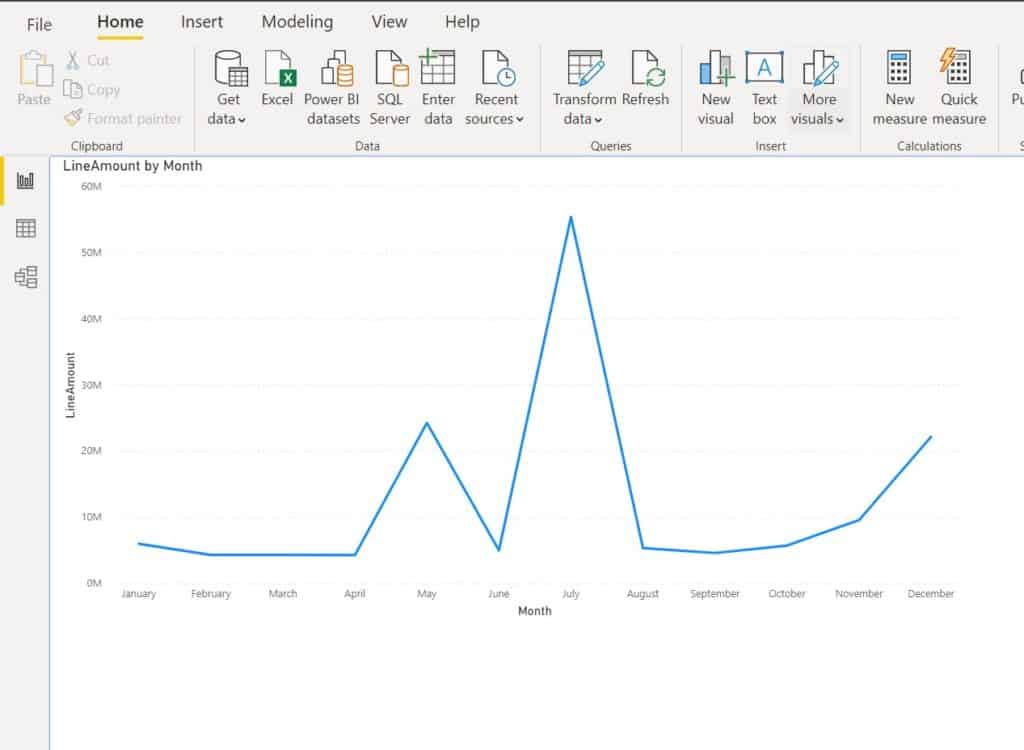
Next click on the visual you want to create. Then drag each field you want to add to the visual to the “Axis”, “Values”, or legend sections depending on the type of visual you are using.
Publish Your Power BI Report
When you are ready to publish the report, you can click File > Publish > Publish to Power BI. Select the workspace you want to publish to and click the “Ok” button.
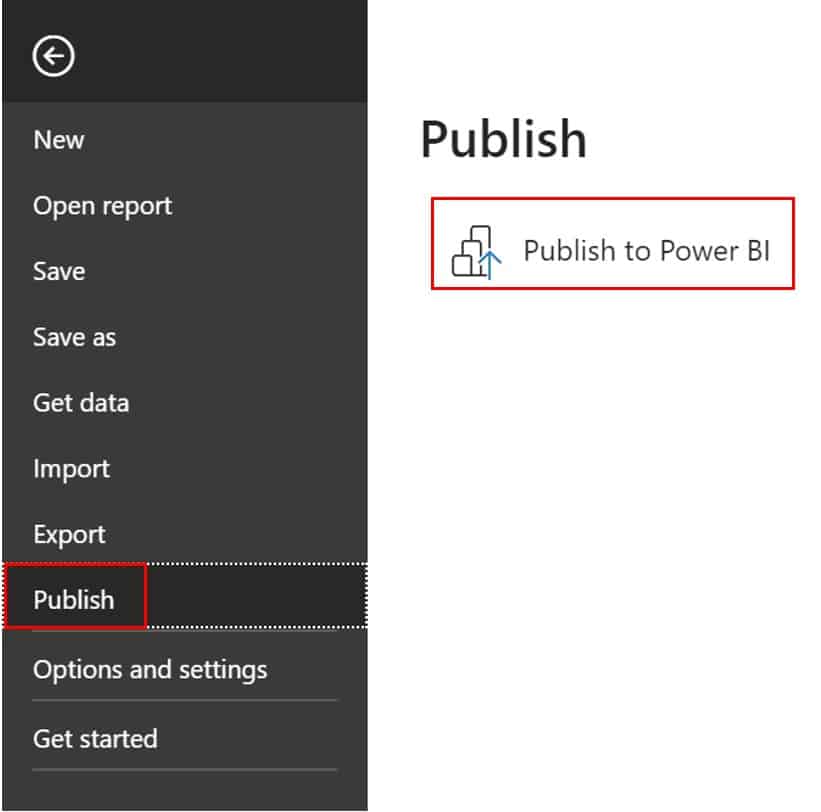
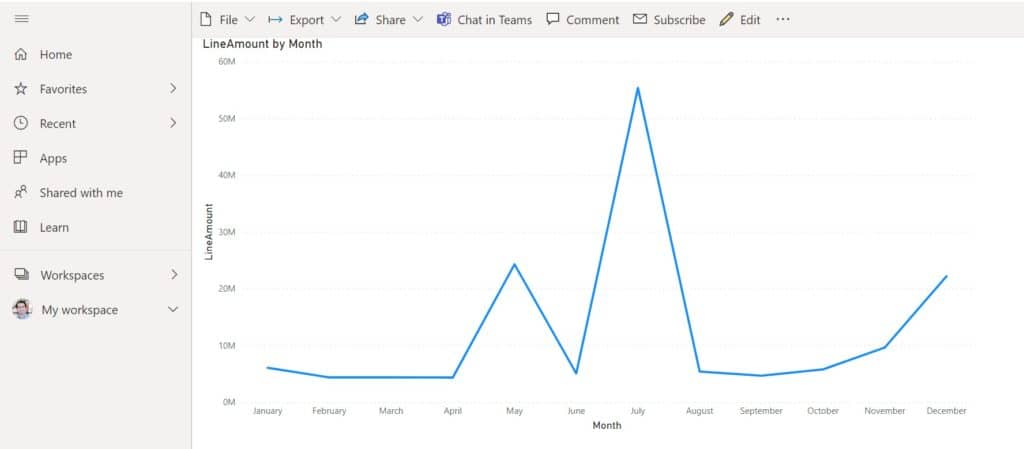
Now you can go back to powerbi.com and view your published Power BI report with the Dynamics 365 Finance and Operations data. If you have a Power BI Pro license you can also share your reports with others.
Comments
Post a Comment